What is an Easy Way to Use a Tally Chart
What is a tally chart? A tally chart is a quick and easy way of recording data. It involves filling in a chart with vertical dashes representing each time a piece of information is observed.
Tally charts are useful as it is quicker to record data with a dash than it is to repeatedly write out words or figures. Also, the data is immediately divided into categories or groups ready to be analysed.
Here is an example tally chart which is investigating the favourite colours of children in Year 5:

The example demonstrates how it is quicker and clearer to interpret data when tally marks are used, instead of re-writing the word 'blue' every time a child says that this is their favourite colour.
When there are five tally lines, the fifth is recorded by drawing the line across the first four, like so:

Grouping the results in 5s then makes it easier to add up the total frequency at the end, rather than adding up each individual dash.
It is also helpful to include a total (or frequency) column so that the totals can be added up at the end of the investigation.
When do children learn to use tally charts?
In Year 3 teachers will introduce children to tally charts by giving them simple examples to fill out within the classroom. Example topics could include the favourite hobbies or favourite food of each child.
Teachers will also explain the benefit of recording data in a tally chart. Once children have started to use tally charts in the classroom, teachers might show them how the data they have collected can be represented in other formats, such as bar charts and pictograms.
It is important that children are comfortable with tally charts, as they will continue to interpret data from them throughout KS2.
It is likely that the KS2 Maths SATs questions will require children to know how to use and interpret tally charts. Therefore, it is imperative that children have had enough practice to be comfortable doing this independently.
How will children use tally charts to construct bar charts and pictograms?
Pictograms use pictures instead of tally dashes to represent data, and they are introduced to children in KS1 as an easy visual method of counting information.
Teachers may get children to record information (such as the favourite animal of pupils in the class) in a tally chart format before it can be converted into a pictogram. For example:


Children may then be presented with more complicated questions involving pictograms where a single image represents multiple objects. For example:

Once children have learnt to convert tally charts into pictograms, they will then be introduced to bar charts as a way of recording data. Teachers will initially give children pre-drawn axis and ask them to draw and colour in blocks representing the number of something.
In KS2 children will begin to draw their own bar charts on squared paper, which involves an understanding of vertical and horizontal axis and how best to count the numbers (in 2s, 5s, 10s etc.).
Teachers will also inform children of the importance of drawing each bar with the same width by using a ruler to correctly measure the bars.
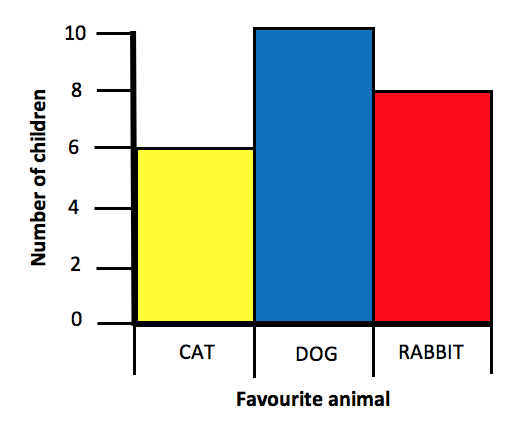
For example, the pictogram above can be drawn as a bar chart like so:

How does Learning Street help children with tally charts?
Tally charts form part of our courses, where relevant, from year three onwards. We introduce the concept then extend knowledge then revise as we do with most areas.
Children find that their knowledge builds over time and they can confidently use tally charts in their work and interpret information in these charts.
Our Courses
Click through to review the courses we have available
- Independent School 11 Plus Exam Preparation Courses
- Grammar School 11 Plus Exam Preparation Courses
- Primary School Improvement/Development Courses
Source: https://www.learningstreet.co.uk/articles/what-is-a-tally-chart/
0 Response to "What is an Easy Way to Use a Tally Chart"
Post a Comment